Hao Li
My Portfolio
Monitoring your supercomputer runtime
Suppose you work on superclusters, there is not a lot you can do to use UI, but you still want something handy.
Suppose you have many cores, and you want a better htop because your terminal space is not big enough.
a simpler way to monitor this is to use mpstat (and use awk to organize it to columns)
watch -n 1 "mpstat -P ALL 1 1 | awk 'NR>4 {printf \"CPU %s: %s%%\\n\", \$3, \$12}' | pr -10 -t -w $(tput cols)"
but to be fancy,
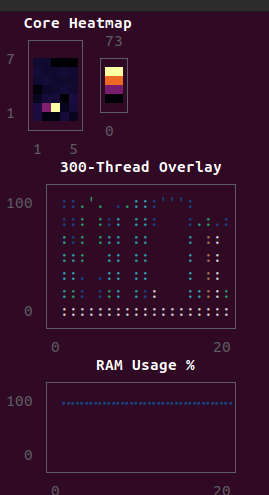
This is the julia code that does it (with UnicodePlots.jl). Just run this in bash.
julia -e 'using UnicodePlots; n=Sys.CPU_THREADS; cols=Int(floor(sqrt(n))); rows=Int(ceil(n/cols)); hist=zeros(n,20); ram_h=Float64[]; p_i=zeros(n); p_t=zeros(n); while true; l=readlines("/proc/stat")[2:n+1]; c_i=[parse(Int,split(ln)[5]) for ln in l]; c_t=[sum(parse.(Int,split(ln)[2:8])) for ln in l]; d_i=c_i.-p_i; d_t=c_t.-p_t; usage=[dt>0 ? 100*(1-di/dt) : 0.0 for (di,dt) in zip(d_i, d_t)]; global p_i=c_i; global p_t=c_t; global hist=hcat(hist[:,2:end], usage); m=readlines("/proc/meminfo"); total=parse(Int,split(m[1])[2]); avail=parse(Int,split(m[3])[2]); push!(ram_h, 100*(1-avail/total)); if length(ram_h)>20 deleteat!(ram_h,1) end; print("\033[H\033[2J"); display(heatmap(transpose(reshape([usage; zeros(rows*cols-n)], cols, rows)), title="Core Heatmap", colormap=:inferno)); plt=lineplot(hist[1,:], title="300-Thread Overlay", ylim=[0,100], width=cols*4, height=7, canvas=DotCanvas); for i in 2:n lineplot!(plt, hist[i,:]) end; display(plt); length(ram_h)>1 && display(lineplot(ram_h, title="RAM Usage %", ylim=[0,100], width=cols*4, height=4, color=:blue)); sleep(1); end'
Here is a script to write logs for the system incrementally:
#!/bin/bash
# Temperature and Power Monitor
# Keeps last 10 seconds of CPU/GPU temps, power, and memory (rolling buffer)

LOG_DIR="./logs"
LOG_FILE="$LOG_DIR/system_monitor.csv"
MAX_LINES=6  # header + 5 readings (2 sec each = 10 sec)

mkdir -p "$LOG_DIR"

# Write CSV header
echo "timestamp,cpu_pkg_temp,cpu_core_max,gpu_temp,gpu_power_w,gpu_fan_pct,nvme_temp,ram_used_gb,ram_total_gb,ram_pct,gpu_mem_used_mb,gpu_mem_total_mb,gpu_mem_pct" > "$LOG_FILE"

echo "Monitoring system temps, power, and memory (last 10 sec rolling)..."
echo "Logging to: $LOG_FILE"
echo "Press Ctrl+C to stop"
echo ""

while true; do
    TIMESTAMP=$(date '+%Y-%m-%d %H:%M:%S')

    # CPU temps
    CPU_PKG=$(sensors 2>/dev/null | grep "Package id 0:" | awk '{print $4}' | tr -d '+°C')
    CPU_CORE_MAX=$(sensors 2>/dev/null | grep "Core" | awk '{print $3}' | tr -d '+°C' | sort -n | tail -1)

    # GPU stats (temp, power, fan, memory)
    GPU_INFO=$(nvidia-smi --query-gpu=temperature.gpu,power.draw,fan.speed,memory.used,memory.total --format=csv,noheader,nounits 2>/dev/null | tr -d ' ')
    GPU_TEMP=$(echo "$GPU_INFO" | cut -d',' -f1)
    GPU_POWER=$(echo "$GPU_INFO" | cut -d',' -f2)
    GPU_FAN=$(echo "$GPU_INFO" | cut -d',' -f3)
    GPU_MEM_USED=$(echo "$GPU_INFO" | cut -d',' -f4)
    GPU_MEM_TOTAL=$(echo "$GPU_INFO" | cut -d',' -f5)
    GPU_MEM_PCT=$(echo "scale=1; $GPU_MEM_USED * 100 / $GPU_MEM_TOTAL" | bc 2>/dev/null)

    # NVMe temp
    NVME_TEMP=$(sensors 2>/dev/null | grep "Composite:" | awk '{print $2}' | tr -d '+°C')

    # System RAM
    RAM_INFO=$(free -g | grep Mem)
    RAM_TOTAL=$(echo "$RAM_INFO" | awk '{print $2}')
    RAM_USED=$(echo "$RAM_INFO" | awk '{print $3}')
    RAM_PCT=$(free | grep Mem | awk '{printf "%.1f", $3/$2 * 100}')

    # Append new reading
    echo "$TIMESTAMP,$CPU_PKG,$CPU_CORE_MAX,$GPU_TEMP,$GPU_POWER,$GPU_FAN,$NVME_TEMP,$RAM_USED,$RAM_TOTAL,$RAM_PCT,$GPU_MEM_USED,$GPU_MEM_TOTAL,$GPU_MEM_PCT" >> "$LOG_FILE"

    # Keep only last MAX_LINES (header + 5 data rows)
    tail -n $MAX_LINES "$LOG_FILE" > "$LOG_FILE.tmp" && mv "$LOG_FILE.tmp" "$LOG_FILE"

    # Print to console
    printf "\r[%s] CPU: %s°C | GPU: %s°C @ %sW | RAM: %s/%sGB (%s%%) | VRAM: %s/%sMB (%s%%)  " \
        "$TIMESTAMP" "$CPU_PKG" "$GPU_TEMP" "$GPU_POWER" "$RAM_USED" "$RAM_TOTAL" "$RAM_PCT" "$GPU_MEM_USED" "$GPU_MEM_TOTAL" "$GPU_MEM_PCT"

    # Warn if temps are high
    if (( $(echo "$CPU_PKG > 85" | bc -l 2>/dev/null) )); then
        echo -e "\n⚠️  WARNING: CPU temp critical!"
    fi
    if (( $(echo "$GPU_TEMP > 85" | bc -l 2>/dev/null) )); then
        echo -e "\n⚠️  WARNING: GPU temp critical!"
    fi

    sleep 0.2
done